
The product
A clear answer to
“what changed?”
Start with two workbooks. Finish with a clear view of the differences and the context to understand them.
- 01
Choose your files.
Add the trusted baseline and the new output. Comparing a full report run? Choose two folders instead.
- 02
Set your checks.
Compare what matters to your work, from cell values to borders and worksheet structure. Use ignore rules and tolerances where you need them.
- 03
See what changed.
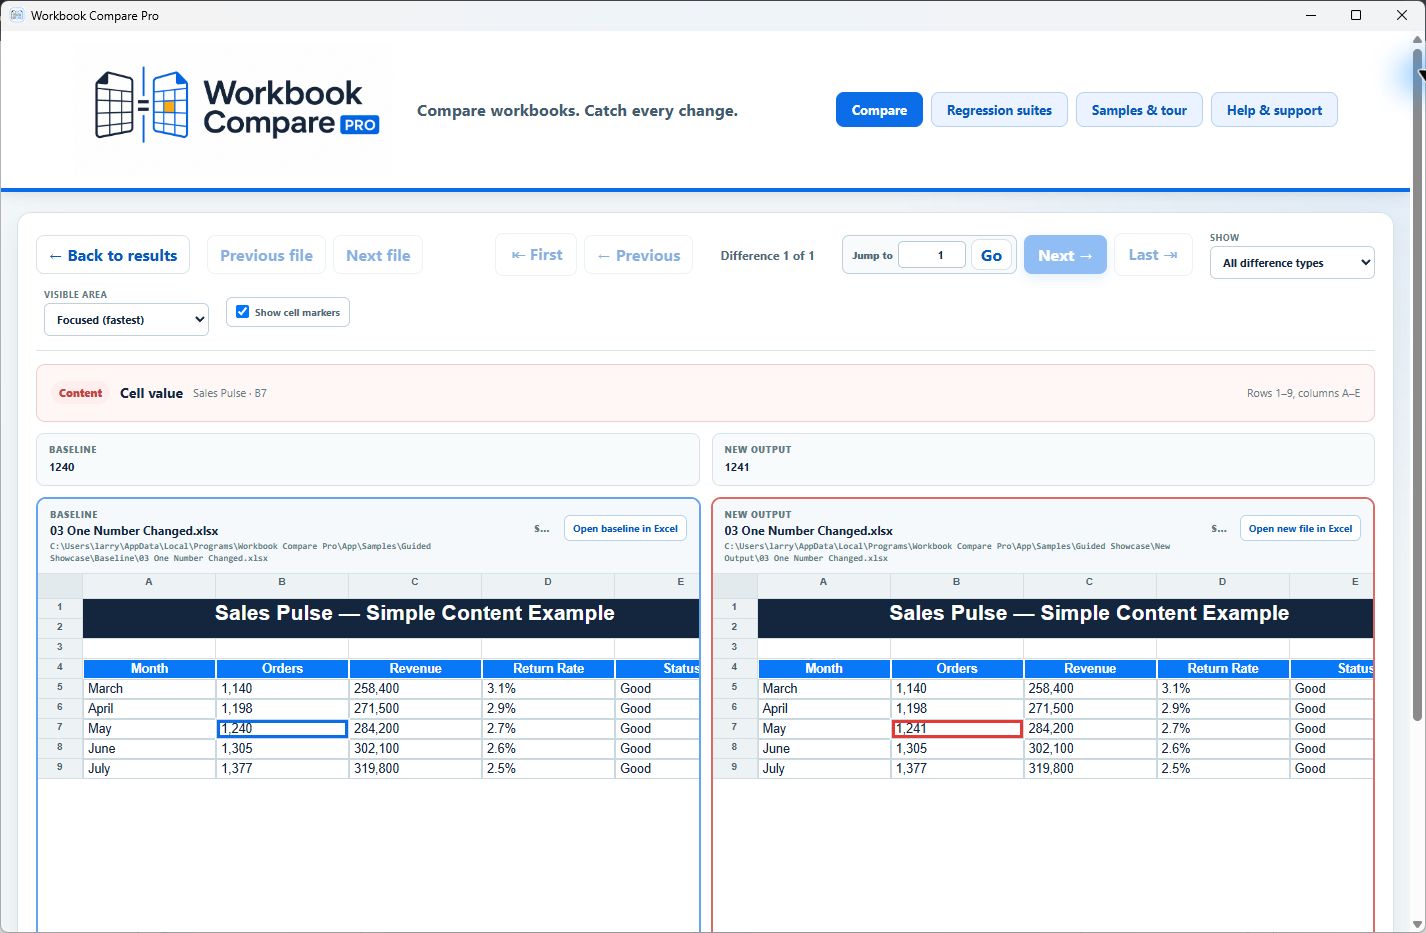
Open both versions side by side. Jump between differences with the surrounding rows and columns in view.
- Values & formulas
- Compare cell contents, saved values, and formula text. Formulas are compared as written, without recalculation.
- Formatting & presentation
- Fonts, fills, borders, number formats, row heights, column widths, and other workbook details.
- Workbook structure
- Worksheets, images, hyperlinks, freeze panes, and print settings. Folder results show missing and new files too.
- CSV & TSV
- Compare exported data by position or an optional key column. Ignore selected columns and apply numeric tolerances.
Same job next week?
Keep the setup.
Run it again.
Save file paths and comparison options in a project. Group projects into Regression Suites for repeatable checks across your output.
Export HTML or CSV reports, or run saved suites from the command line for scheduled QA work.
A few useful specifics.
Excel layouts stay positional. Rows and columns are compared in their original positions. Useful for consistent tables and report output, including WinCross.
Comparison runs locally. Workbook contents stay on your PC. Normal comparison is read-only. Accepting a new baseline is a separate confirmed action with a safety backup.
Know the file formats. Supports .xlsx, .csv, and .tsv. Save .xls as .xlsx first. Macro-enabled .xlsm files aren’t supported.
Your next workbook is a good place to start.